
Whooph Trades - KOLD
NatGas Heads Lower on Strength. Due to Stubbornly high Production, Supply.

NatGas Heads Lower on Strength. Due to Stubbornly high Production, Supply.
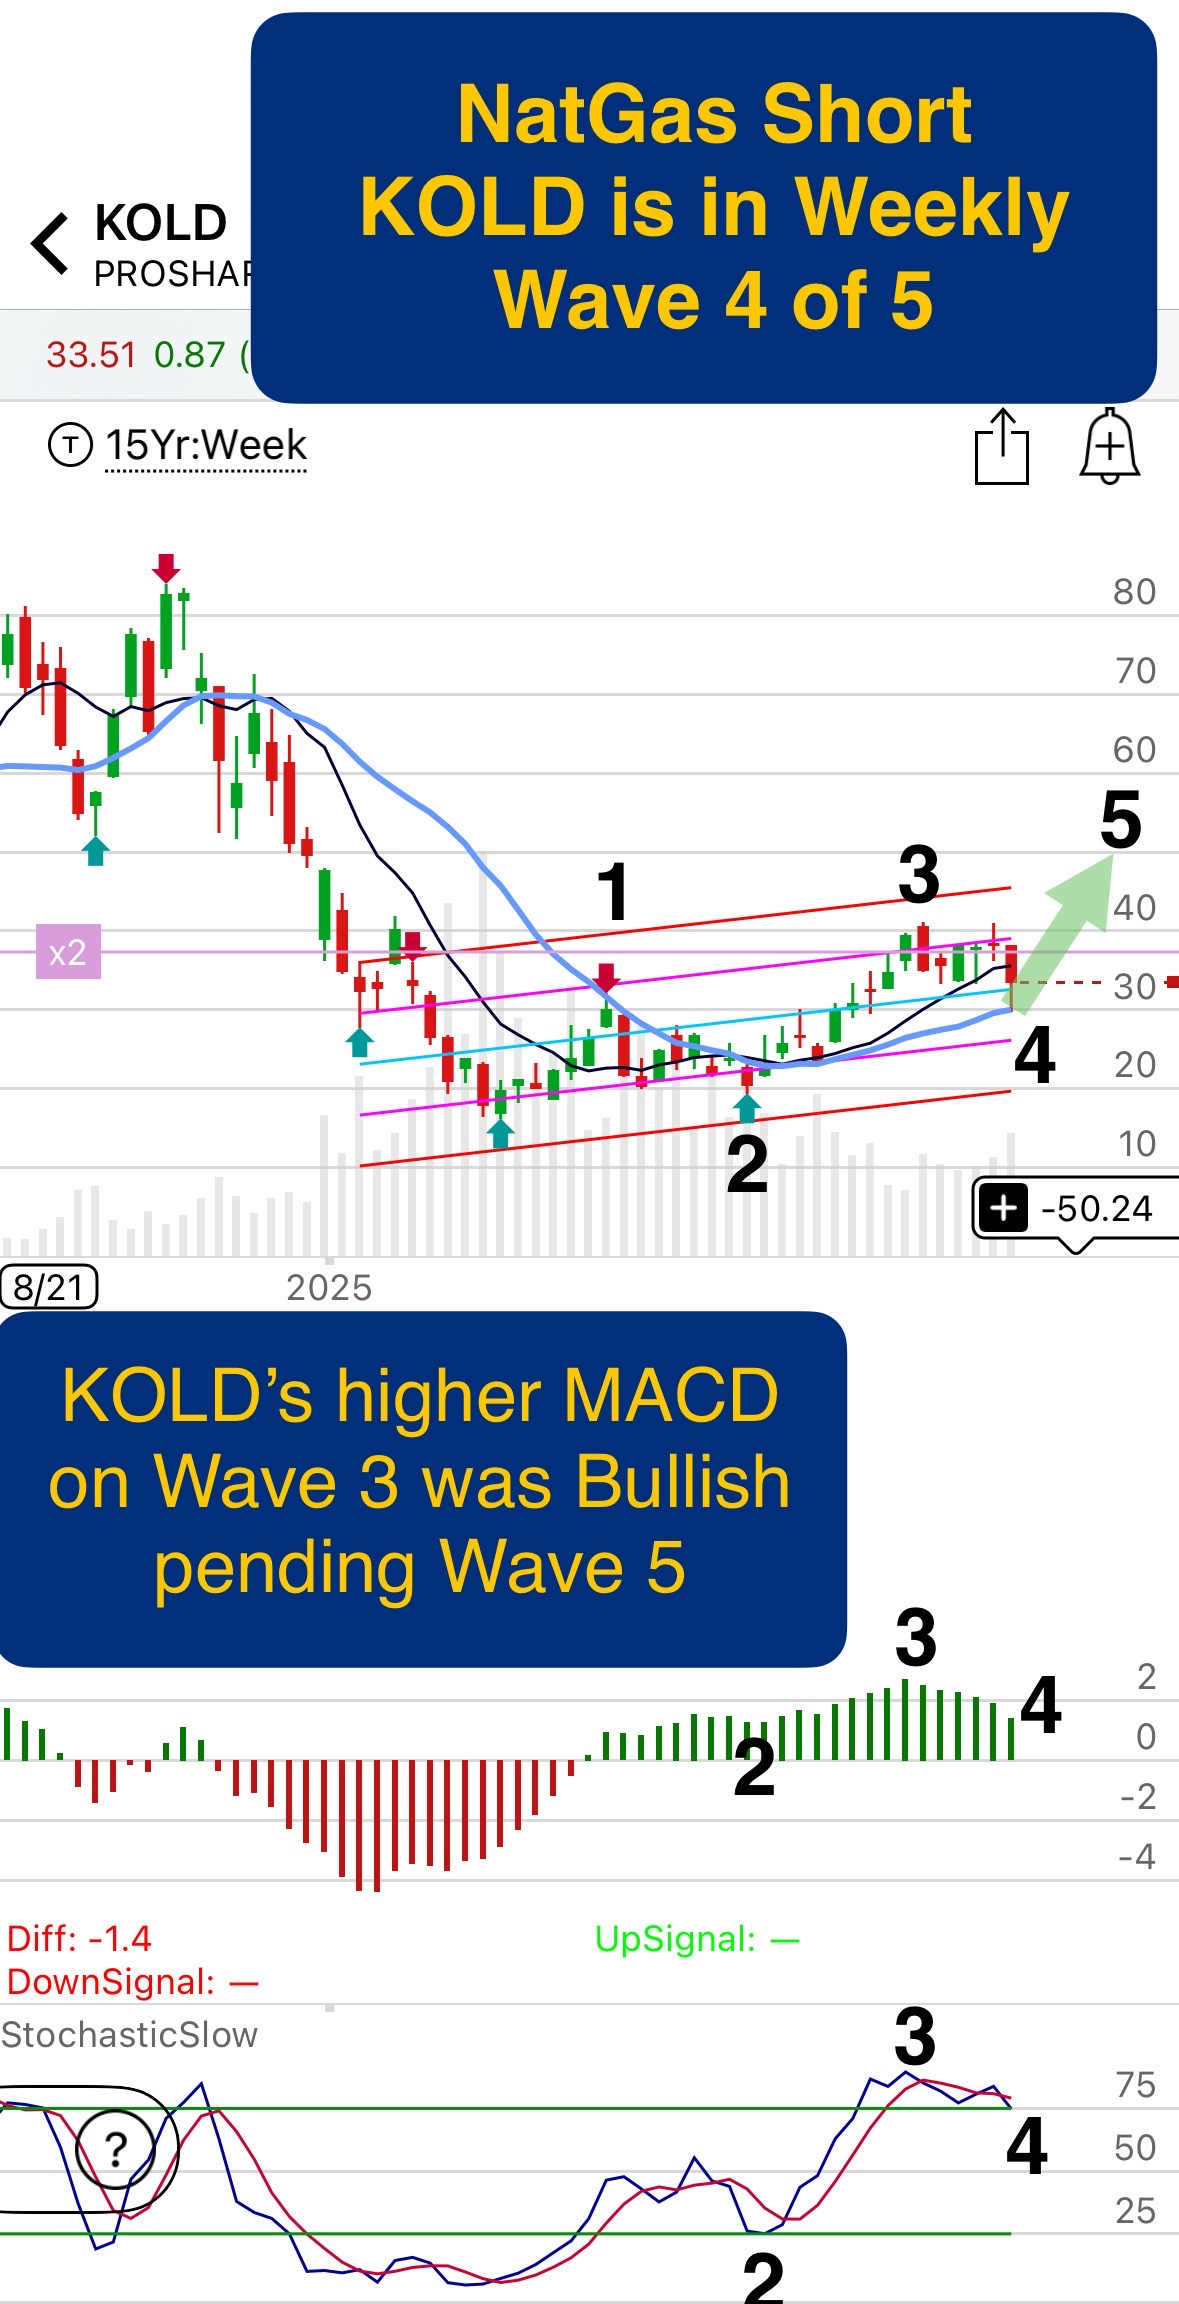
KOLD is a 2x ETF Inverse of Bloomberg Natural Gas Subindex futures index on Natural Gas. KOLD is likewise a popular ETF used by traders positioning SHORT on Natural Gas.
Fundamentals suggest stubbornly high production and injections to already high NatGas inventories will keep downward pressure on Nat Gas prices. In concert, KOLD will continue higher to complete Elliott Wave 5 of 5 shown in the chart.
Whooph heeds equity and commodity fundamentals but since 1999 he’s studied all sorts of divergences revealed between Price and Indicator highs and lows.
Predictive Indicators are Income
His niche: Divergences between what’s measured — speed and momentum of Price — versus the Indicator doing the measuring. Why? The simple observation gives repeatability of trade income. Whooph’s Method allows a trader to see market moves before they happen via predictive market signals which markets cannot hide!
George Lane puts it:
Price has MOMENTUM.
Indicators do NOT.
Hence, predictive inferences exist.
Regular market-generated Price v. Indicator disagreement reveals why Lane makes this cryptic statement, a clear endorsement on his STOCHASTIC oscillator invention. Whooph reads these disagreements otherwise known as divergences and offers predictive commentary, which could mean new income for traders willing to learn it.
Lane’s revolutionary Stochastic invention tripled his commodity trade profits and apparently cut the workloads on his commodities futures trader cohorts down to…making coffee! Thank you, Lane.
When not trading futures, George Lane spent much of his time explaining to agitated analysts the reasons his Stochastic and other momentum tools for measurement can be predictive. eek. Like fingernails on a chalkboard to analysts, and other non-technicians. - Whooph
Market Structure in Living Color
Corroborating bearish fundamentals, the Short NatGas KOLD chart below provided by Whooph shows higher Price highs and in agreement, higher Indicator highs. This means no weakness at least through the end of Wave 3. Which proves Wave 3 is correctly identified and suggests Wave 5 must follow after a brief Wave 4 pull-back. And then invariably MACD weakness will paint end of Wave 5. Then a reversal or corrective consolidation. That’s market structure in living color!
Natty Gas Reversal Long
By then, traders will ne thinking long NG. NatGas traders will be staring down the barrel of our NatGas’ heating season, often beginning as early as November. The exact time for the Natural Gas reversal up will be foreseen in some Price-Indicator spat.
Depending on breadth and severity of Winter Freeze, NG freeze offs, Liquid Natural Gas (LNG) exports, and whatever geopolitical shenanigans, DEMAND for NatGas will hit.
Whooph expects to fade long on NatGas late October to early November. A bit too early to call it right now.
Charlie Whooph READERS:
Though you may not be interested in the Natty Gas dance, as it were, I strongly recommend the “lesson”. In this and other Whooph Trades lessons, discourse is NOT timed to markets or intended to recommend any BUY, SELL, STOP, or TARGET, by the way.
Lessons cover Markets & Waves, courtesy and thanks to Ralph Nelson Elliott, Price-Indicator Divergences or disagreement (HINT) which Whooph essentially coined, and proper analysis of the most popular indicators ie. Stochastic, MACD, Williams%, RSI, and Mean Averages.
Don’t worry, Whooph gives minimal credence to so-called over-sold, over-bought conditions and often violated trend lines. And he explains why.