Silver’s SELL Structure
Where is Silver going?

Charlie Whooph has been talking about Silver’s Weakness in posts since October 7th and swing-trading Silver on the 4-hour charts.
His last LONG position was October 8th.
Whooph has been entering SHORT positions in Silver since an exhaustion sell-off on October 9th. Why?
Because Silver had completed an major END POINT of it’s Uptrend Structure October 16th: longer term Wave 5.
This Wave 5 was corroborated by a weakness in Indicators RSI and MACD. This “weakness” consisted of disagreement between Price and Indicators: LOWER Indicator highs in the 4-Hourly Chart even as Price made higher highs.
Term: Price-Indicator Disagreement confirms weakness which PRECEDES every swing, correction or reversal.
ABC Corrective Waves
The in-progress Wave 5 will complete CORRECTIVE Wave A of a normal ABC Correction.
So, Whooph continues to watch and see these predictive normal wave patterns complete and play out.
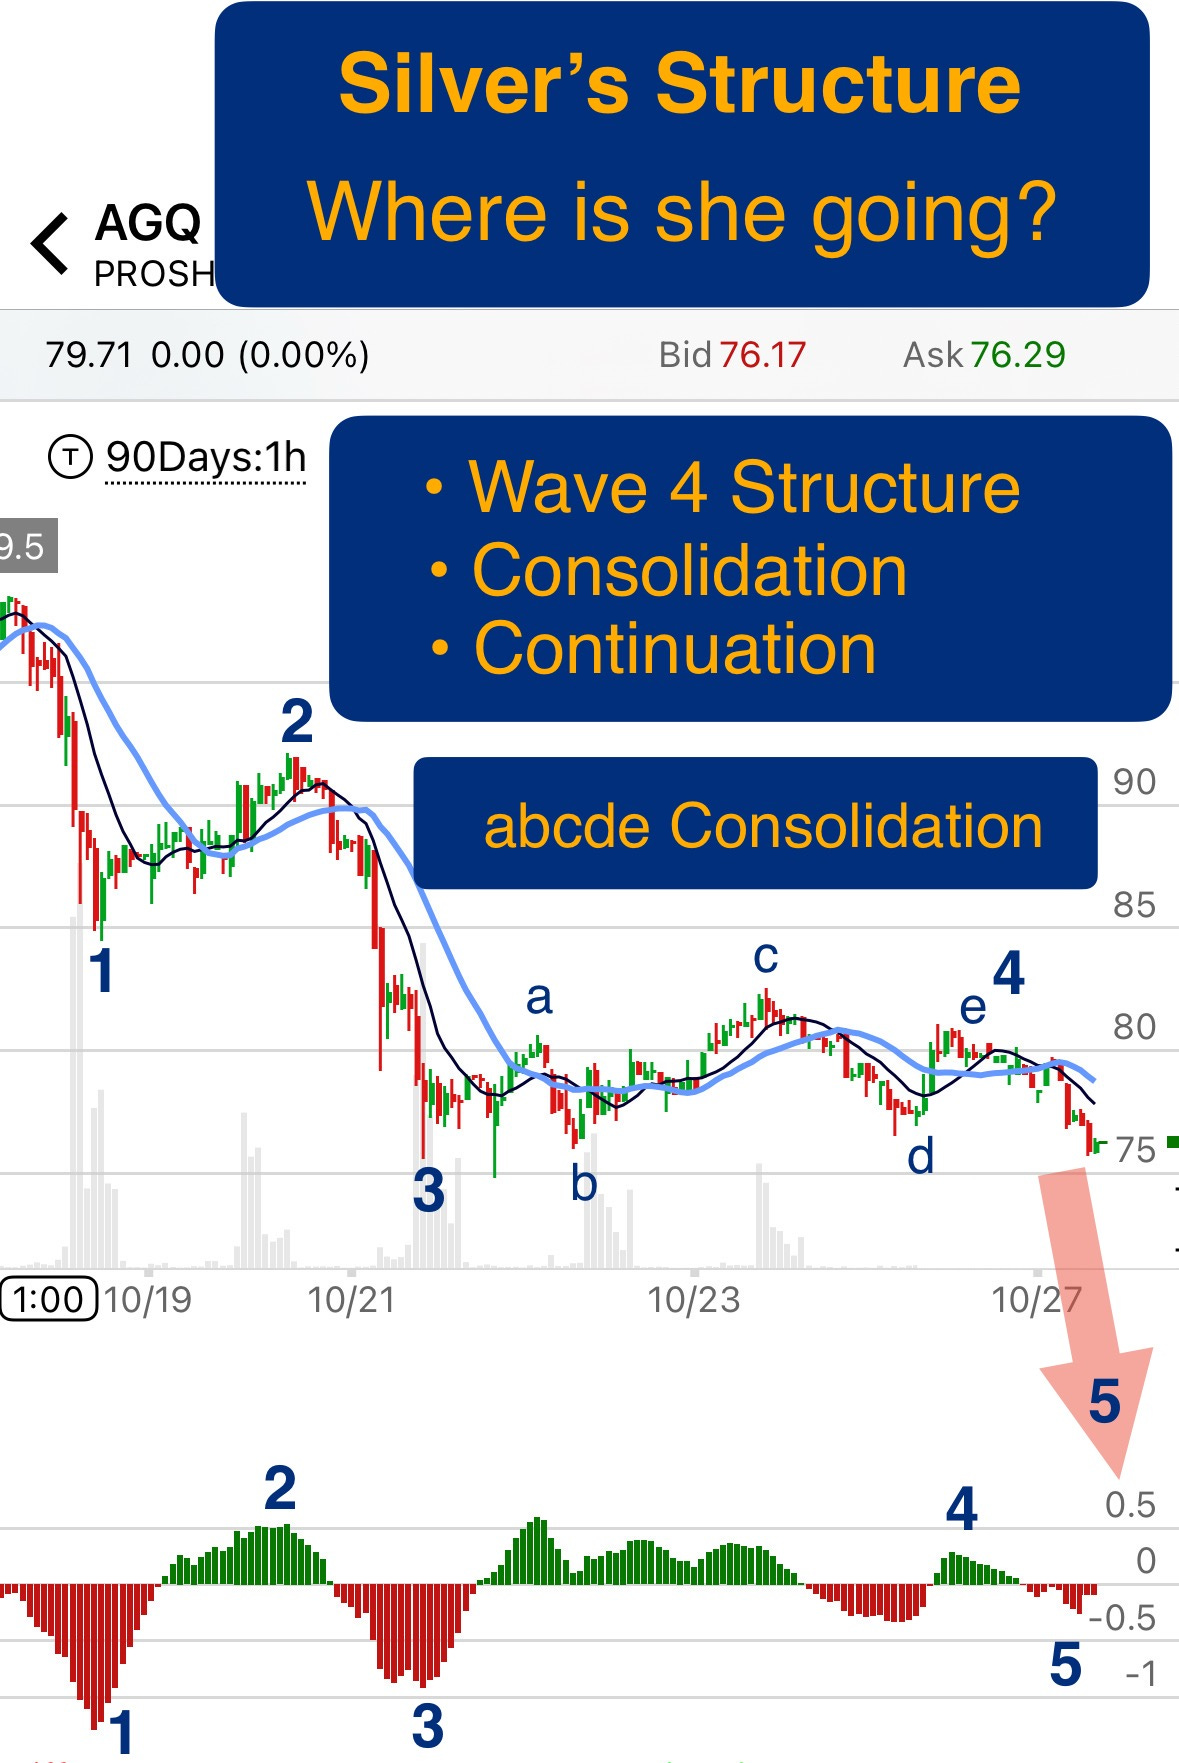
The graph below illustrates how YOU can dissect Waves 1 (down), 2(up), 3 (down), and Wave 4 (consolidation) yourself.
Term: Consolidation is seen in the NORMAL “a b c d e” Pattern traders call consolidation. Wave 4 completed with Thursday’s consolidation “Wave e” and Friday confirmed it with the start of Wave 5.
Corrective Wave A
Silver’s Wave 5 (down) completes the longer term Corrective Wave A.
Corrective Wave B
After the sellers’ Corrective Wave A, buyers will step in with a brief uptrend, Corrective Wave B.