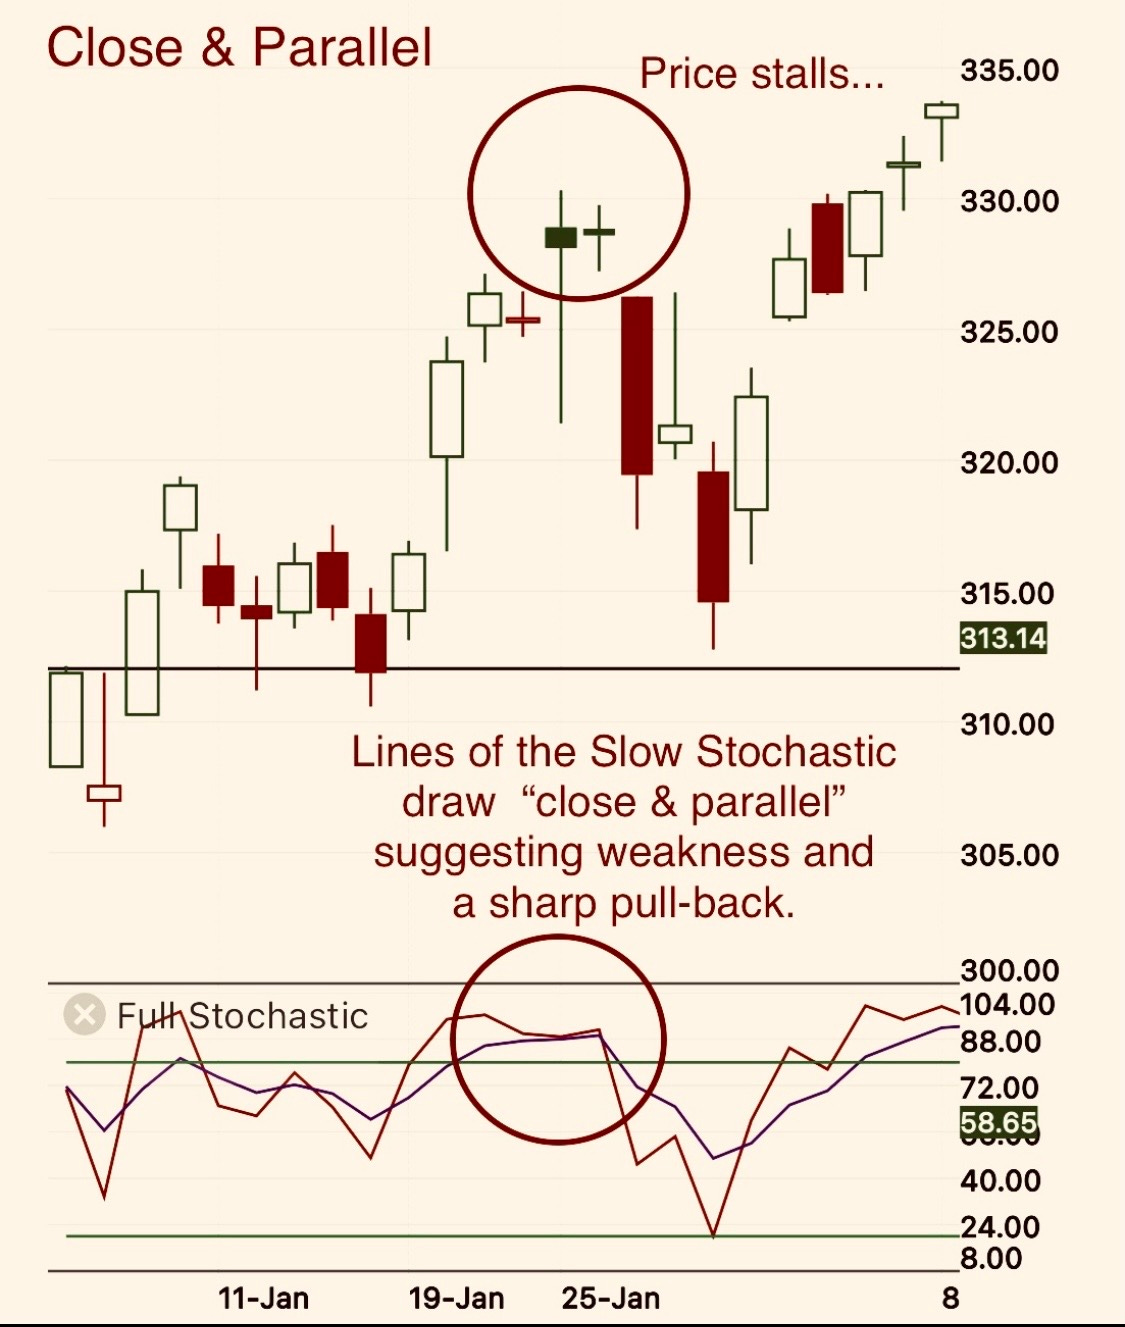
Can George Lane’s Stochastic Oscillator foreshadow swings or reversals before price knows it?
Dr. Lane was a smart guy to recognize a predictive nature of his measurement, naturally complimented by a market’s psychology of Traders in Large Numbers.
THE FORMULA
for the Stochastic Oscillator:
%K = (C−L14) / (H14−L14) × 100 where:
C = the most recent closing price;
L14 = the lowest price traded of the 14 previous trading sessions;
H14 = the highest price traded during the same 14-day period;
%K = current value of the stochastic indicator
THE CONFRONTATION
I know, you’re bugged by the implication of historical data being able to predict anything. Irritating, isn’t it.
So, it was when a group of market analysts set out to corner George Lane, demanding that he explain himself in suggesting his Stochastic is predictive.
George Lane, feeling the tension in the room uttered a terse reply:
Price has momentum.
Stochastic does NOT.
Lane’s words hung in the air, as did the silence of his interrogators. No one dared to ask him another question.
THE WHOOPH
In the sample chart above, the faster RED stochastic (signal line) juts in to the slower BLACK) line. This is a warning or precursor of change. Then, upon the equity or stock’s continuance of its rally, price inks a higher high suggesting no evidence of price weakness whatsoever!
However, Dr. Lane’s Stochastic seems to disagree. The signal line specifically. Is it that, Stochastic’s signal line turned first, before Price? Or more that it fails to “catch up” and vault higher in sync with the higher price action?
Analysts are hamstrung by their bias and their pre-conceived notions that this Indicator must certainly be lagging. “It’s mapping historical data!” they exclaim.
But George Lane knows something that his critics have all dismissed or buried to press their case against predictability of this or any other oscillating indicator.
The EXPLANATION
There was a change in the average 14-period momentum. The math formula for Stochastic effectively draws an “alligator snout” profile or what the Whooph calls Close n Parallel as shown in the header image above.
The circled portion of Stochastic shows the tell-tail: even as price registers a higher high, the Stochastic faster RED signal line hugs the BLACK and is unable to diverge or pull away from the slower BLACK line, suggesting weakness. Who would know?
George Lane did explain the mystery. Price, the thing being measured, has momentum. The Indicator, does NOT. Stochastic, is measuring that momentum, it knows first of any change, and so it turns first. The principle behind Divergence.
In a sense, an oscillator has the skinny. The “inside information”. Independent, advance notice, for in real time with respect to price, Stochastic measures, and detects a change in momentum, while Price is yet uninformed indifferent, and frankly subject-to whatever forces are propelling it.
Similarly, fundamentals causing market movement make for a horrible timing mechanism for gauging Price swings.
Stochastic knows first, so it turns first.
It is in fact ahead of Price, more nimble, and able to display a weakness in Price before Price or anyone else knows it!
To venture a guess…
Only, the most seasoned price-action student might be able to detect Price weakness foretelling a swing or reversal without the help of an Oscillator like George Lane’s Stochastic or MACD.
The Whooph Close n Parallel label is an observation or an interpretation of the Stochastic tool, which from decades of daily price-indicator comparison and data correlation, has come to suggest disagreement foretelling a swing or reversal in price.
In a follow-on post we’ll delve into other types or renditions of divergence — a similar phenomena as Close n Parallel©️2007 and the holy-grail of predictive signals.
LOOKING BACK
Would you believe equity or stock momentum begins to suffer WELL BEFORE price action even “knows it” ? This is true especially if you’re NOT actively gauging change in momentum against the prior average momentum 14–28 days ago. And who would be?!
What percentage of traders do this or even know what relative highs to look at over a greater than 14-day period, when trying to gauge an impending swing in price let alone a swing reversal or correction or crash?
Is it even possible? Plenty of criticism spews from critics in caustic, sarcastic tones, suggesting market price action is completely random and unpredictable outside of news or earnings. ( Ha!…really? )
So, which is it? Is a market reversal predictable or not? This very same principle was already on display well beforeThursday, February 20th, 2020. Not just days, but WEEKS before the crash.
Can you see it?
©️ Charlie Whooph 2025
DISCLAIMER
This content is for educational, informational, and entertainment purposes only. Nothing herein should be considered as investment, business, legal, or financial advice pertaining to your specific situation, goals, needs, or risk tolerance. Ideas published by me or Whooph LLC on Whooph.com, Charlie Whooph.Substack, or Whooph Trades Publication on Substa…